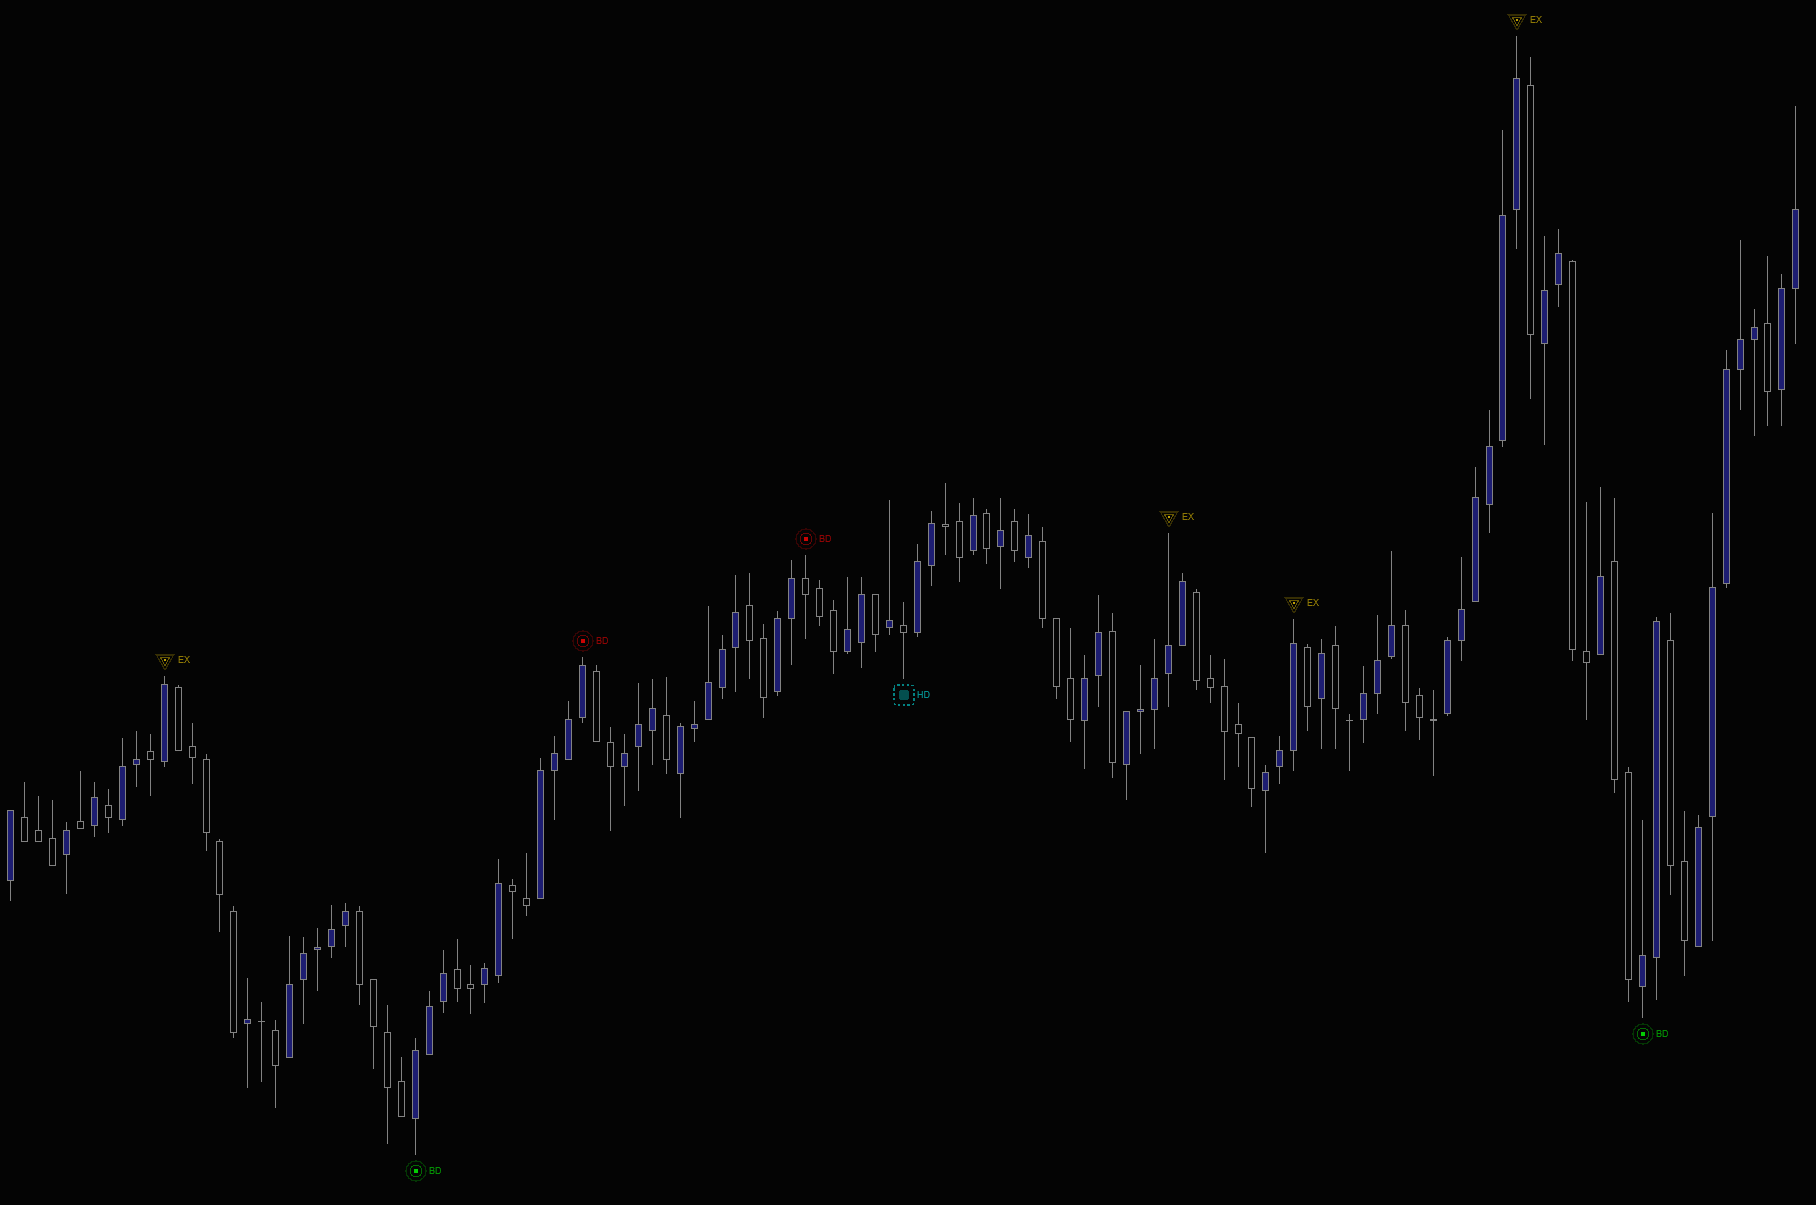
Price sweeps the high. The CVD is already falling. Volume hits a level inside your killzone, and price refuses to move. A wick prints on exhausted delta and starts to reverse. Flux marks every one of those signatures. Divergence, absorption, exhaustion. On the candle they happen, before price confirms. The setup the model says is reversing, with the orderflow telling you whether it actually is.
By the time a reversal is obvious in price action, most of the move is already over. The actual shift happens underneath. In the delta. Price makes a higher high while aggressive buying dries up. Volume spikes into a level but price refuses to move. The wick extends on exhausted participation.
These are the signatures of institutional repositioning, and they're invisible on a standard candlestick chart. You'd need a footprint chart, a CVD panel, and a DOM window open simultaneously to piece together what's happening.
Flux synthesizes all of it into discrete markers directly on your price chart. No extra panels. No footprint subscription. It processes every tick through a multi-layer detection engine. Swing-point delta comparison, absorption scoring with OBI and dispersion filters, and exhaustion thresholds. Then renders clean, labeled glyphs at the exact bar where the signal fires.
Price makes a new extreme while CVD moves in the opposite direction. The classic reversal setup. Aggressive participation is fading even as price pushes higher or lower. Rendered as concentric pulse rings.
Price pulls back but delta holds its ground or moves against the pullback. Confirms the existing trend has absorbed the counter-move and is likely to continue. Rendered as dashed rounded squares.
Bar delta exceeds a configurable multiple of the rolling average absolute delta. The aggressive side has fired everything it has, and may have nothing left. Rendered as concentric triangles pointing toward the extreme.
Volume spikes above its rolling average, the candle body stays narrow relative to the range, and delta opposes price direction. Confirmed by OBI (Order Book Imbalance), low price dispersion, or extreme absorption score. Rendered as concentric diamonds.
Extreme absorption score with low price dispersion, but without a clear directional absorption signal. Marks a contested price level where significant passive interest exists on both sides. Rendered as a bullseye target.
Tracks a rolling N-bar high and low using left-side-only confirmation. When the next bar closes back away from the extreme and delta diverges, the signal fires immediately. You get the signal one bar after the extreme. Before right-side confirmation exists.
Tradeoff: Faster signals, but some will fire at extremes that don't hold. Best for scalpers and intraday traders who want early warning and can manage false positives with other confluence.
Waits for a full swing confirmation. N bars on both sides of the extreme must hold before the signal is validated. The signal fires at the swing point itself, placed retroactively once the right side confirms.
Tradeoff: Higher accuracy, but signals arrive N bars late. Best for swing traders and those using Flux for post-session analysis or strategy validation.
Every tick is classified as a buy or sell using bid/ask comparison. Bar delta and cumulative volume delta (CVD) are computed tick by tick for maximum accuracy. No reliance on NinjaTrader's built-in OrderFlow engine.
Depending on your mode, Flux identifies swing highs and lows using either rolling N-bar extremes (Reactive) or full N-bar confirmed pivots (Confirmed). CVD values are cached at each swing for divergence comparison.
Each bar gets an absorption score: aggressive volume divided by price range. Combined with Order Book Imbalance (OBI) from Level 2 depth, price dispersion tracking, and statistical thresholds (Z-score against rolling mean) to filter noise.
Qualifying events are registered with bar index, signal type, anchor price, and vertical position. SharpDX renders each glyph with a dashed stem connecting it to the price level. Hardware-accelerated for zero flicker even at high tick rates.
Confirmed and Reactive buttons with active-state highlighting. Switch mid-session. The chart refreshes instantly with the new mode's signals.
Independent toggles for Bullish Divergence, Bearish Divergence, Hidden Divergence, Exhaustion, Absorption, and Absorption Nodes.
Show or hide the two-letter labels (BD, HD, EX, AB, AN) next to each glyph. Clean mode for screenshots, labeled mode for learning.
Swing strength, volume SMA length, spike multiplier, narrow body ratio, exhaustion multiplier, OBI threshold, and dispersion threshold. All tunable from the indicator properties.
Price sweeps through a key high or low. But is the move continuing or reversing? Flux answers that in real time. When exhaustion (EX) fires at the sweep extreme and divergence (BD) confirms that aggressive flow is fading, the sweep is complete and the reversal has begun. No guessing, no waiting for a candle close.
When a bearish divergence (BD) fires at a swing high and an exhaustion print (EX) fires on the same bar or the bar before, that's a two-layer confirmation that the upside is spent. Combine with Anvil showing a large resting ask at that level and the setup is institutional-grade.
Hidden divergence (HD) fires during a pullback in an established trend. Price looks like it's reversing, but delta says the original direction still has the stronger hand. The pullback is being absorbed. The trend is about to resume.
When an absorption signal (AB) fires, it means someone with significant size is defending a price level with passive limit orders. Volume is spiking into the level but price won't budge. The candle body is narrow despite heavy volume. That's a floor (or ceiling) being built in real time.
Absorption nodes (AN) mark price levels where passive interest is extreme on both sides but neither side has won. These are the battleground levels. The prices where the next directional move will be decided. Watch how Hammer and Anvil interact at these nodes for the breakout direction.
Running a funded account evaluation? Confirmed mode gives you only swing-validated signals. Higher accuracy, fewer false positives. Use divergence and exhaustion as entry filters to avoid chasing moves that are already spent. Reactive mode gives you early warning for live trading when speed matters more than certainty.
| Requirement | Details |
|---|---|
| Platform | NinjaTrader 8 on Windows. No Order Flow+ subscription required. |
| Data feed | Level 1 tick data for delta/CVD and divergence detection. Level 2 depth data (Rithmic, CQG) enhances absorption scoring via OBI. Tick Replay must be enabled for historical signals. |