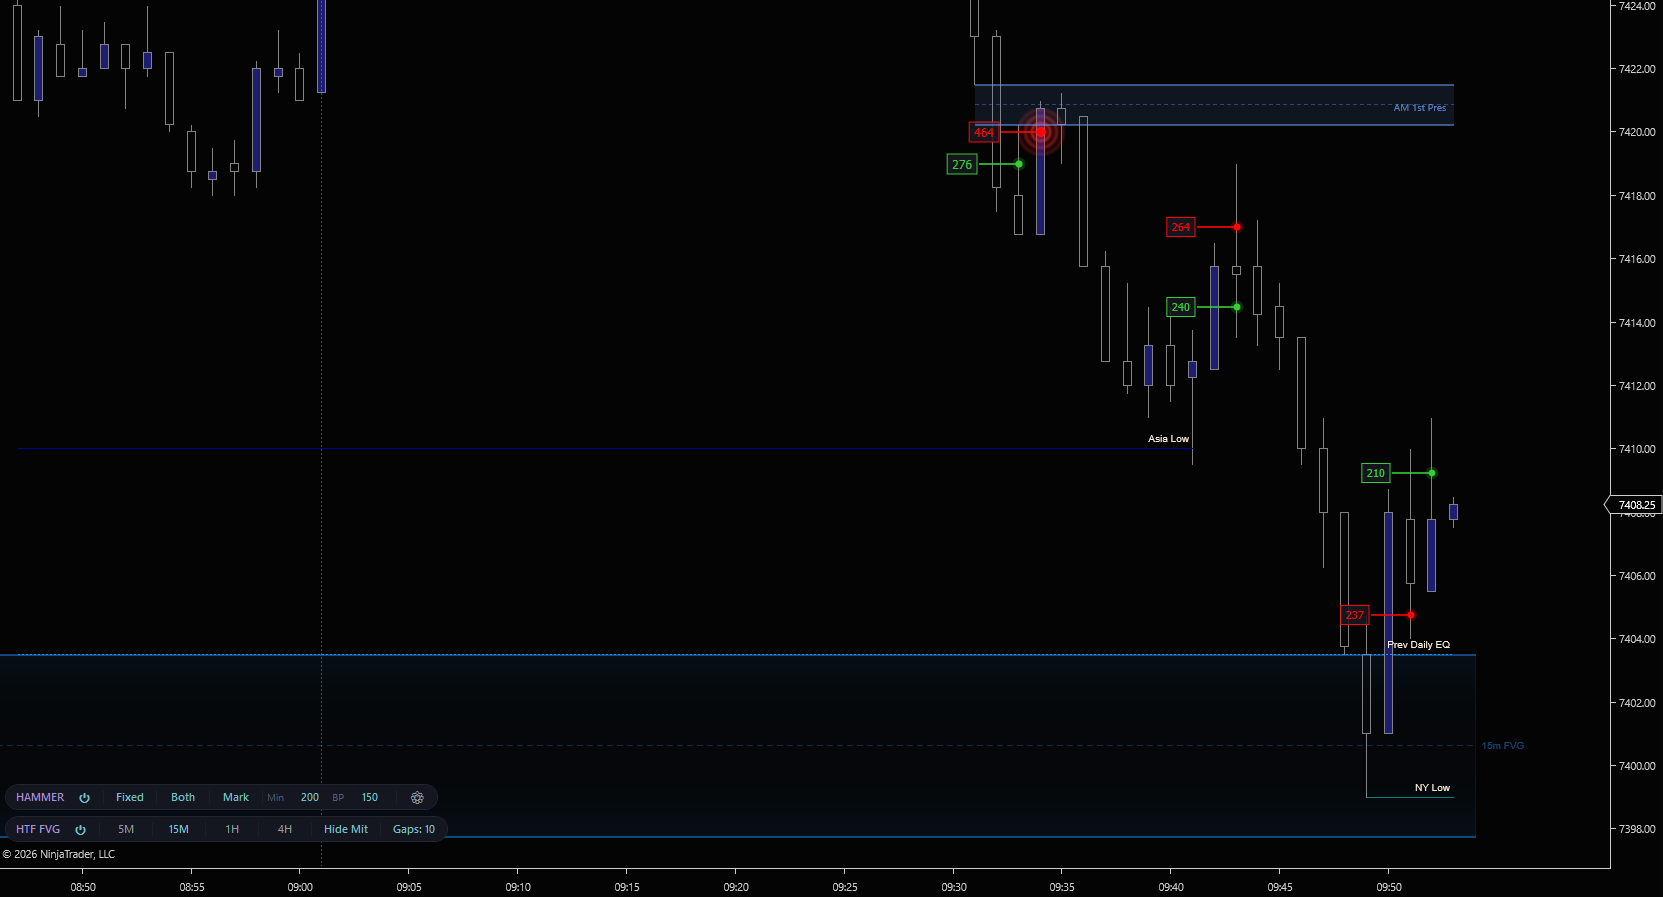
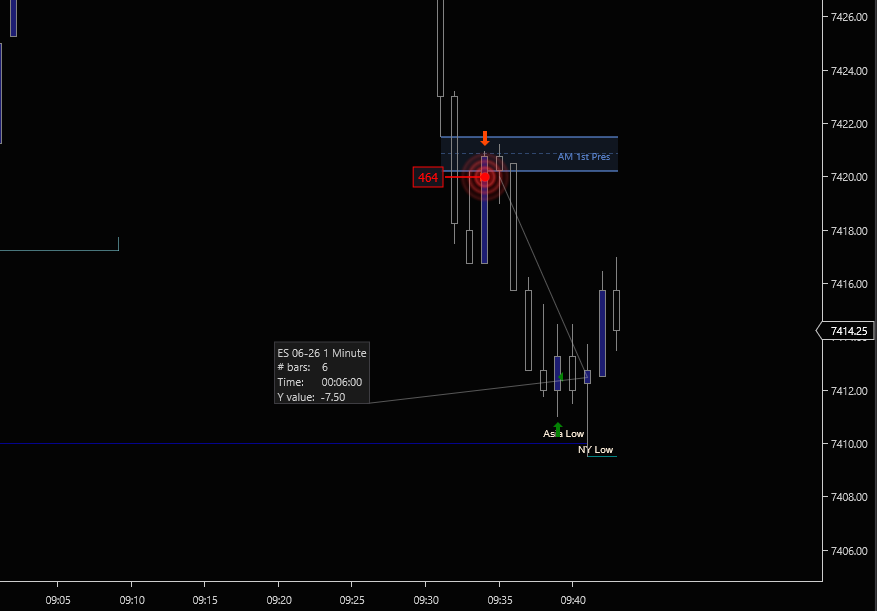
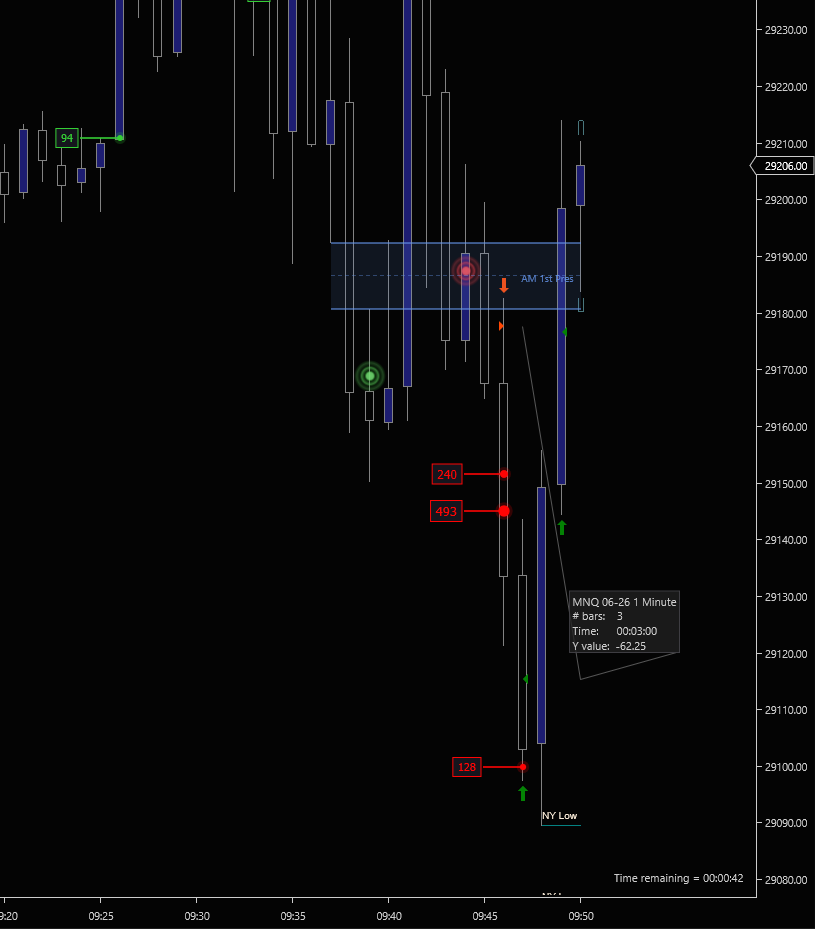
Since 2009, exchanges have shredded institutional orders into hundreds of small fills. The 800-lot sell that broke your bias hits the tape as forty 20-lot prints across three milliseconds, and your displacement candle looks like retail noise. Hammer reassembles those fragments tick by tick and prints the true aggregate size on the candle that did the damage. The Big Print halo takes it one step further: every single institutional fill above your threshold gets its own ring at the exact bar and price, so the trades that confirm a setup inside your FVG, OB, or sweep level are marked the instant they happen. Trade the micro? Point Hammer at the mini and the institutional size from the mini paints right on your micro chart.
Since 2009, exchanges have broken large orders into small execution prints. A fund selling 800 contracts doesn't show up as one 800-lot trade. It shows up as hundreds of 1- to 10-lot fills spread across milliseconds. The raw Time & Sales tape makes institutional activity look like retail noise. That displacement candle you're watching? You have no idea whether it was a 50-lot retail market order or an 800-lot institutional entry. Unless you can reconstruct the original order.
Hammer reverses this fragmentation. It classifies every tick as a buy or sell, groups consecutive same-side fills that arrive within milliseconds of each other, and reassembles them into a single marker showing the true aggregate size. The 800-lot sell becomes visible again, and now you know whether the displacement was backed by real institutional participation or just thin-market drift.
Consecutive same-side fills that arrive within your aggregation window (default 4ms) are grouped together into a single cluster. The volumes are summed. When the side flips or time gaps, the cluster is finalized.
If multiple clusters land on the same bar at similar price levels (within your merge tick range), they're combined into one marker. The final marker shows the total reconstructed volume. The true institutional size.
Big Print runs as its own stream. Whatever you have set for cluster aggregation (Fixed, Both, Mark), Big Print still fires on every single trade that meets the threshold, so the institutional fills inside your zones never get filtered out by minimum-cluster rules.
Threshold lives on the chart toolbar pill (BP: nn). Tune it for ES (300+), MES (50+), NQ (200+), MNQ (40+), or whatever instrument you trade. Lower on micros, higher on minis. Change it mid-session. No restart.
Two dedicated output plots, BigPrintBuyVolume and BigPrintSellVolume, expose the Big Print stream to NinjaScript Strategy Builder. Gate entries on Big Print conviction without writing code.
Scalp the micro for sizing flexibility, watch the institutional fills that hit on ES and NQ paint directly on your MES or MNQ chart. Tighter thresholds on the micro, mini-scale prints on screen.
Gold and silver execution on the micros, with the mini-contract orderflow plotted on the same chart. The 100-lot GC sells that move the level in seconds finally show up where you’re placing your trade.
Crude and natural gas execution on the micros, with the institutional flow from the mini ticker rendered live. The fills that drive a sweep through API inventory or EIA prints land on the right chart.
Five ways to set the bar. Cluster (default) marks reconstructed clusters at your Minimum Order Size. Percentile computes the threshold from the top N% of recent clusters — judged against the same time-of-day bucket, so 3 AM tape is never graded on 9:30 standards. Adaptive scales the statistical threshold by current volatility — looser in fast tape, tighter in chop — with Custom exposing the adaptive intensity directly. Fixed is the raw single-print floor.
Six pre-built presets. Dark mode: FlowForged, Classic, Hi-Contrast. Light mode: Blueprint, Terminal, Adaptive. Selecting a theme updates colors, sizes, and opacities at once; individual settings can still be overridden after.
Filter the rendered marks. Show both sides for full context, or isolate to buys or sells when you only care about one side of the book during a directional move.
Two ways to draw a detected cluster. Switch between them live from the popup — the active style reads out on the pill, so you always know how marks are being rendered without opening anything.
Place buy and sell volume labels independently to the left or right of the dot. Separate them to avoid overlap on fast-moving bars where buys and sells fire on the same level.
Cap the number of recent marks rendered. Set a small number for a clean execution chart that only shows what just happened; set 0 to keep the full session history on screen.
Set the minimum cluster volume that produces a mark. Lower to surface more participation; raise to suppress noise. Pair with the Big Print Threshold (BP) on the pill for two independent sensitivity dials.
Hammer’s pill stacks alongside the other FlowForged toolbar pills (Refine, HTF FVG, Tally, and the rest). Move it up or down in the stack to match how you trade. The order persists across NinjaTrader restarts through a side-file, not just the workspace XML, so close-without-save can’t reset your layout.
| Requirement | Details |
|---|---|
| Platform | NinjaTrader 8 on Windows. No Order Flow+ subscription required. |
| Data | Level 1 data feed. Rithmic, CQG, Kinetick, etc. Tick Replay must be enabled in NinjaTrader for historical marks to appear. |