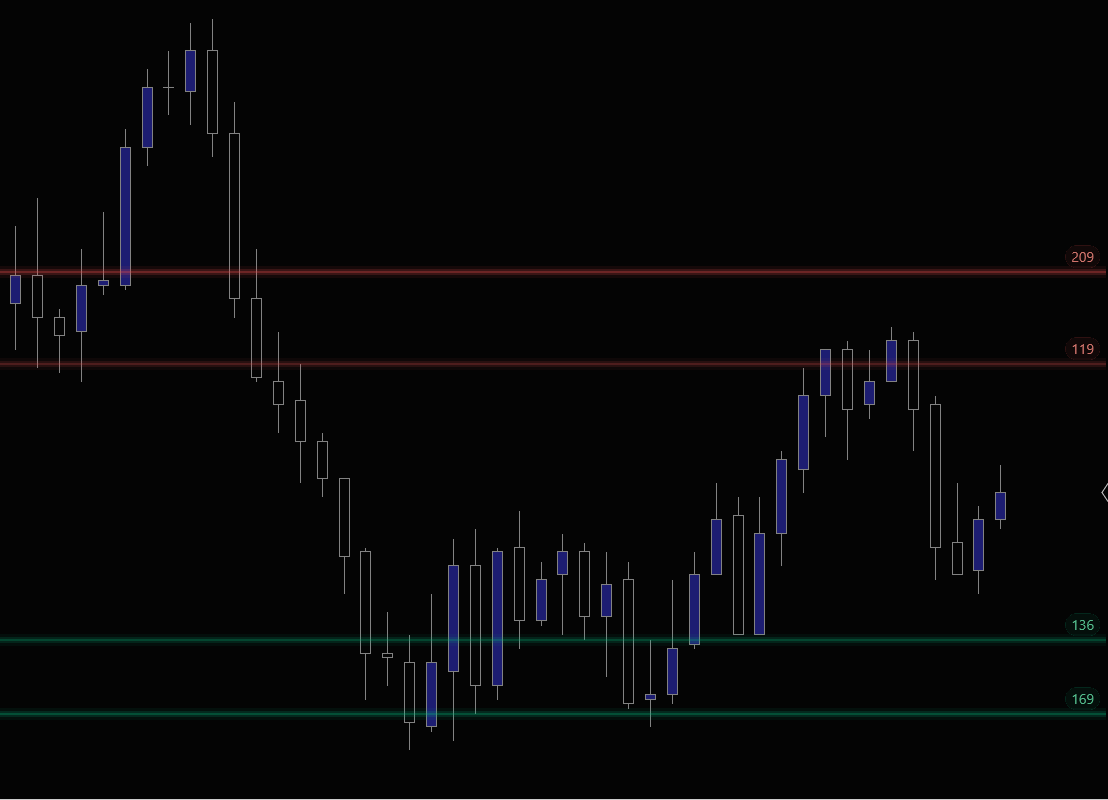
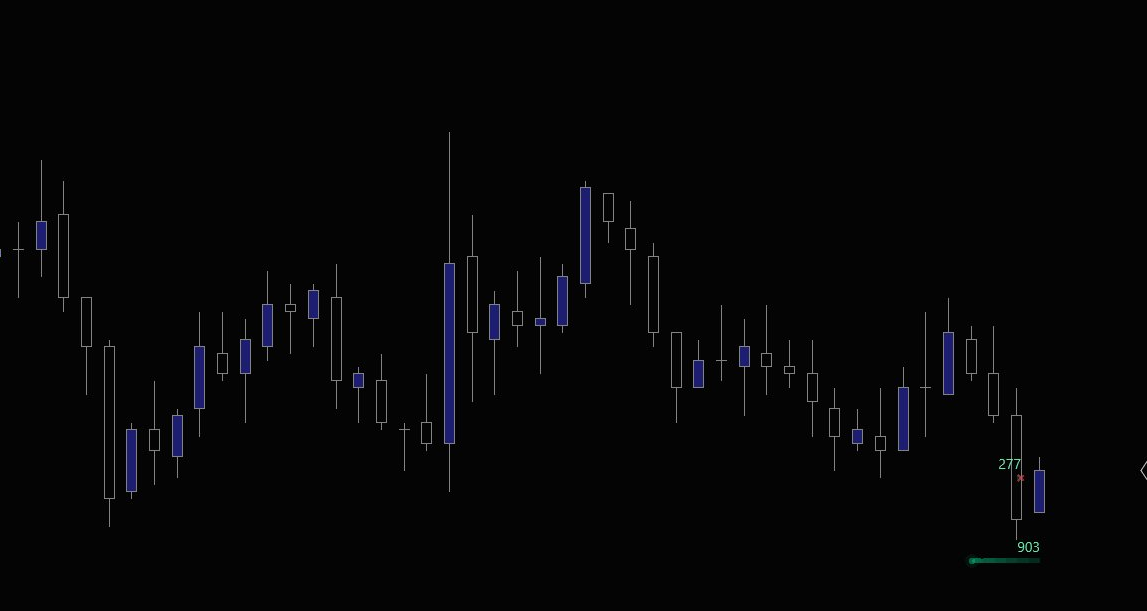
Anvil watches Level 2 depth tick by tick for the resting size that defines a level. When a 500-lot bid appears three points below market, it’s on your chart before the candle finishes. Labeled, color-coded, and tracked from the moment it shows up until the moment it’s pulled, filled, or swept. The liquidity pool the algorithm is delivering price toward, on the chart you’re already watching.
NinjaTrader's SuperDOM shows the current state of the order book. A column of numbers that changes hundreds of times per second. Useful for scalpers who stare at it full-time. Impractical for everyone else.
The critical information buried in that stream is simple: where are the liquidity pools? A 400-lot bid at 5,580.00 on ES isn't noise. It's a participant with conviction placing real capital on the line. That resting order creates a buy-side liquidity pool that acts as a support floor before any volume trades there. When it holds against aggressive selling, that's absorption. When it vanishes before price arrives, the liquidity was pulled, and that tells you something too.
Anvil extracts these orders from the depth stream and projects them directly onto your price chart. Labeled with contract size, color-coded by side, and tracked through their full lifecycle. You see where the liquidity sits before it gets swept, without living inside the DOM.
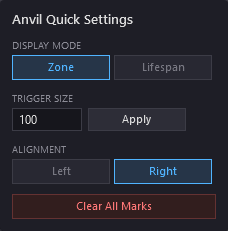
Full-width horizontal bands drawn across your entire chart at each triggered price level. Bigger orders produce brighter, more intense zones, so you can tell at a glance which walls carry the most weight. A small label shows the exact contract count.
Horizontal bars that stretch from the moment an order appeared to the present (or to when it was removed). Active orders glow at their starting point. When an order gets pulled or filled, an × marks where it ended. Labels show the order's peak size.
Anvil hooks into your Level 2 data feed and maintains a live picture of every resting order on both sides of the book. Updated tick by tick as orders are added, changed, or removed.
On every update, it scans both sides for orders that exceed your trigger size threshold. Small retail orders are ignored. Only the meaningful, outsized liquidity makes the cut.
Qualifying orders are followed from the moment they appear to the moment they vanish. Anvil records when they showed up, how big they were at their peak, and when (and if) they were pulled.
Tracked orders are drawn directly on your price chart as zones or lifespan bars. Hardware-accelerated for smooth, flicker-free rendering even on fast-moving instruments.
Price is drawn to liquidity. Anvil shows you exactly where buy-side and sell-side liquidity pools are resting in the order book. The large passive orders that price targets before reversing. When you see a 500-lot bid stacked below a key low, you know where the sweep is headed. That's information the candlestick chart will never give you.
When Anvil marks a large bid and price trades down to that level, you're watching absorption in real time. If the marker stays. If the order doesn't shrink or vanish despite aggressive selling. That's a passive buyer defending the level. Combine with Hammer to see the aggressive side of the same interaction.
A large ask appears above the market. Price moves toward it. The marker vanishes before price gets there. The order was pulled. In Lifespan mode, you see exactly when it appeared and when it was yanked. Whether it was bluffing, repositioning, or just bad timing, Anvil's lifecycle tracking makes the pattern visible.
If Anvil shows a cluster of large resting orders at a price level just below your intended stop. That's a liquidity pool, and price is likely to sweep it. Knowing where these pools sit lets you adjust stop placement to avoid the hunt, or trail behind the wall instead of in front of it. For funded account traders, this awareness is the difference between a stopped-out evaluation and a passed one.
Zone mode turns resting liquidity into horizontal levels that look like traditional support and resistance. Because that's exactly what they are. A 600-lot bid at a round number three handles below the market creates a floor that every DOM reader can see. Zone mode projects it as a structural level across your chart so you don't lose track of it.
Lifespan mode shows which orders have been holding for 15 minutes and which just appeared. A wall that's been defending its price through sustained pressure carries more weight than one that showed up two seconds ago. The bar's length tells you at a glance.
| Requirement | Details |
|---|---|
| Platform | NinjaTrader 8 on Windows. No Order Flow+ subscription required. |
| Data feed | Any provider that delivers Level 2 market depth. Rithmic, CQG, Kinetick, etc. Real-time only (not available on historical replay). |